Project management systems – Earned value management – part 4
Earned value management – part 4
Benefits
The normal method of identifying actual costs in a project and comparing them to planned costs can take time to compile.
This loses the main benefit to personnel in seeing their progress performance in real time.
Earned Value Management provides a simplified and more rapid approach to measuring performance.
It has been widely adopted by many US Government Departments.
The key advantages to Earned Value Management are:
- Like terms are compared and analysed quickly.
- The measurement of ongoing actual work done can normally be taken from timesheets.
Examples
(A)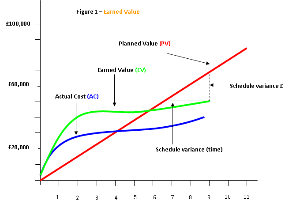
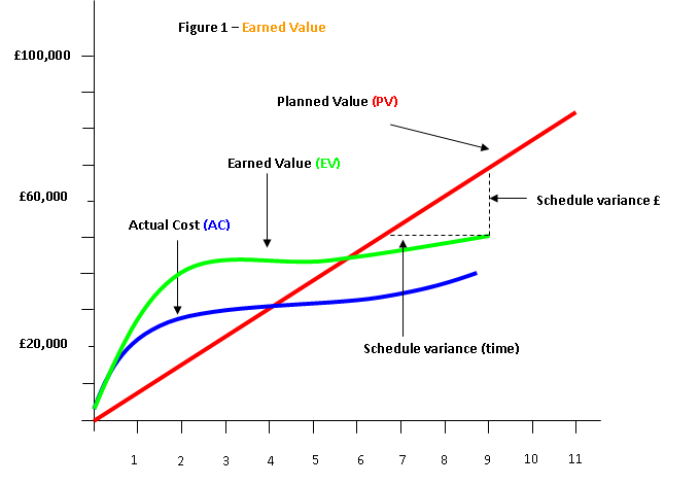
See the diagram above or Figure 1 in the Word file ‘earned value diagram.doc’ in the product package.
The accumulated Planned Value (PV) for the project is shown in the red line.
For this simple case it is assumed that the planned costs occur evenly over the entire project affording a straight line.
Clearly, this would not be the case for a real project.
The blue line shows the accumulated Actual Costs (AC).
Simplistically, it would appear that during the first 4 weeks the project over spent and after that the project under spent.
That is, it was over budget early on and under budget later.
However, we don’t actually know how much work has actually been completed for the spend to date.
For example, if the project has completed at week 9 then the project would have been well under budget and would have finished early.
It could have been only 30% complete at week 9 which would have been grossly under budget with some way to go for completion.
Without knowing how much of the work has been completed the other data is meaningless.
This is where Earned Value Management helps by measuring technical performance objectively and quantitatively.
In the same diagram the green line represents a method for measuring the actual amount of work completed and the spend or ‘value’ associated with it.
This is the ‘Earned Value’ (EV).
Each item in the work breakdown structure will have a ‘Planned Value’ (PV).
The project manager will add up all of the Planned Values for all the completed tasks on a regular basis and record the results.
In the diagram this is done on a weekly basis.
The Earned Value gives a true indication of progress and the diagram shows good progress, ahead of schedule up to week 6 then drops behind.
Note the indication of the ‘schedule variance’ (in £’s and time).
Earned value may also be calculated as ‘Percent Complete’ multiplied by the ‘Budget at Completion (BAC)’.
See terminology definitions [see Project Management Systems – part 9].
This accumulation is called "earned value" (EV), and it can be computed monthly, weekly, or as progress is made.
This could be applied to the whole budget or on a task basis.
For example:
Task completion = 70%
Planned value for the task = £1000
Earned Value = £1000 x 70% = £700
In this case, the Planned Value is similar to the Budget at Completion (BAC) for the whole project.
The diagram, in this case, shows the actual costs below the Earned Value curve.
Hence, the project is performing under budget which is good.
Thus, comparing the Earned Value curve to the Planned Value curve provides Schedule Variance [see Detailed Planning – part 13]. Comparing Earned Value to the Actual Cost provides Cost Variance [see Detailed Planning – part 13].
(B)In a sample project, where the scheduled expenditure is £40,000 per week for the first four weeks, then:
The Planned Value [or Budgeted Cost of Work Scheduled (BCWS)] = £160,000 for the 4 weeks.
The Actual Cost is [or Actual Cost of Work Performed (ACWP)] = £120,000
Deciding on the true status of the project from this information is difficult.
The project could be on track and under-spending or it could be behind schedule and over-spending.
Knowing the Earned Value [or Budgeted Cost for Work Performed (BCWP)] will help determine the project status.
If we know that the Earned Value = £100,000, we have:
Cost Variance = Earned Value – Actual Costs = £100,000 - £120,000 = minus £20,000 = -16.7%.
That is, the project is 16.7% overspent.
Schedule Variance = Earned Value – Planned Value = £100,000 - £160,000 = minus £60,000 = -37.5%
That is, the project is 37.5% behind schedule.
PRINCE2® 2009 describes project monitoring within the Progress theme.
The purpose of the Progress theme is to establish mechanisms to monitor and compare actual achievements against those planned; provide a forecast for the project objectives and the project’s continued viability; and control any unacceptable deviations.
Two of the principles of PRINCE2 [see ‘The Complete Project Management plus PRINCE2’] are managing by stages and continued business justification.
The Progress theme provides the mechanisms for monitoring and control, enabling the critical assessment of ongoing viability.
[see Progress - purpose]
PRINCE2® is a Registered Trade Mark of the Office of Government Commerce in the United Kingdom and other countries.